Mapping Network
For the software project, I choose to do network mapping. One of the topics that the reading "Six degrees of separation"
addressed is mapping in order to form some kind of navigation system. Nodes and links. These two elements have me relate to
online game I play: Star Wars: The Old Republic. In this game, players travel from planet to planets to accomplish missions and
all kind of gaming contents. So I thought what if I can map out players' movements in a day to players' behavior and form some kind
of navigation system. I chose 20 players on my friend list and ask them how they usually travel in the game on a given day. I map out
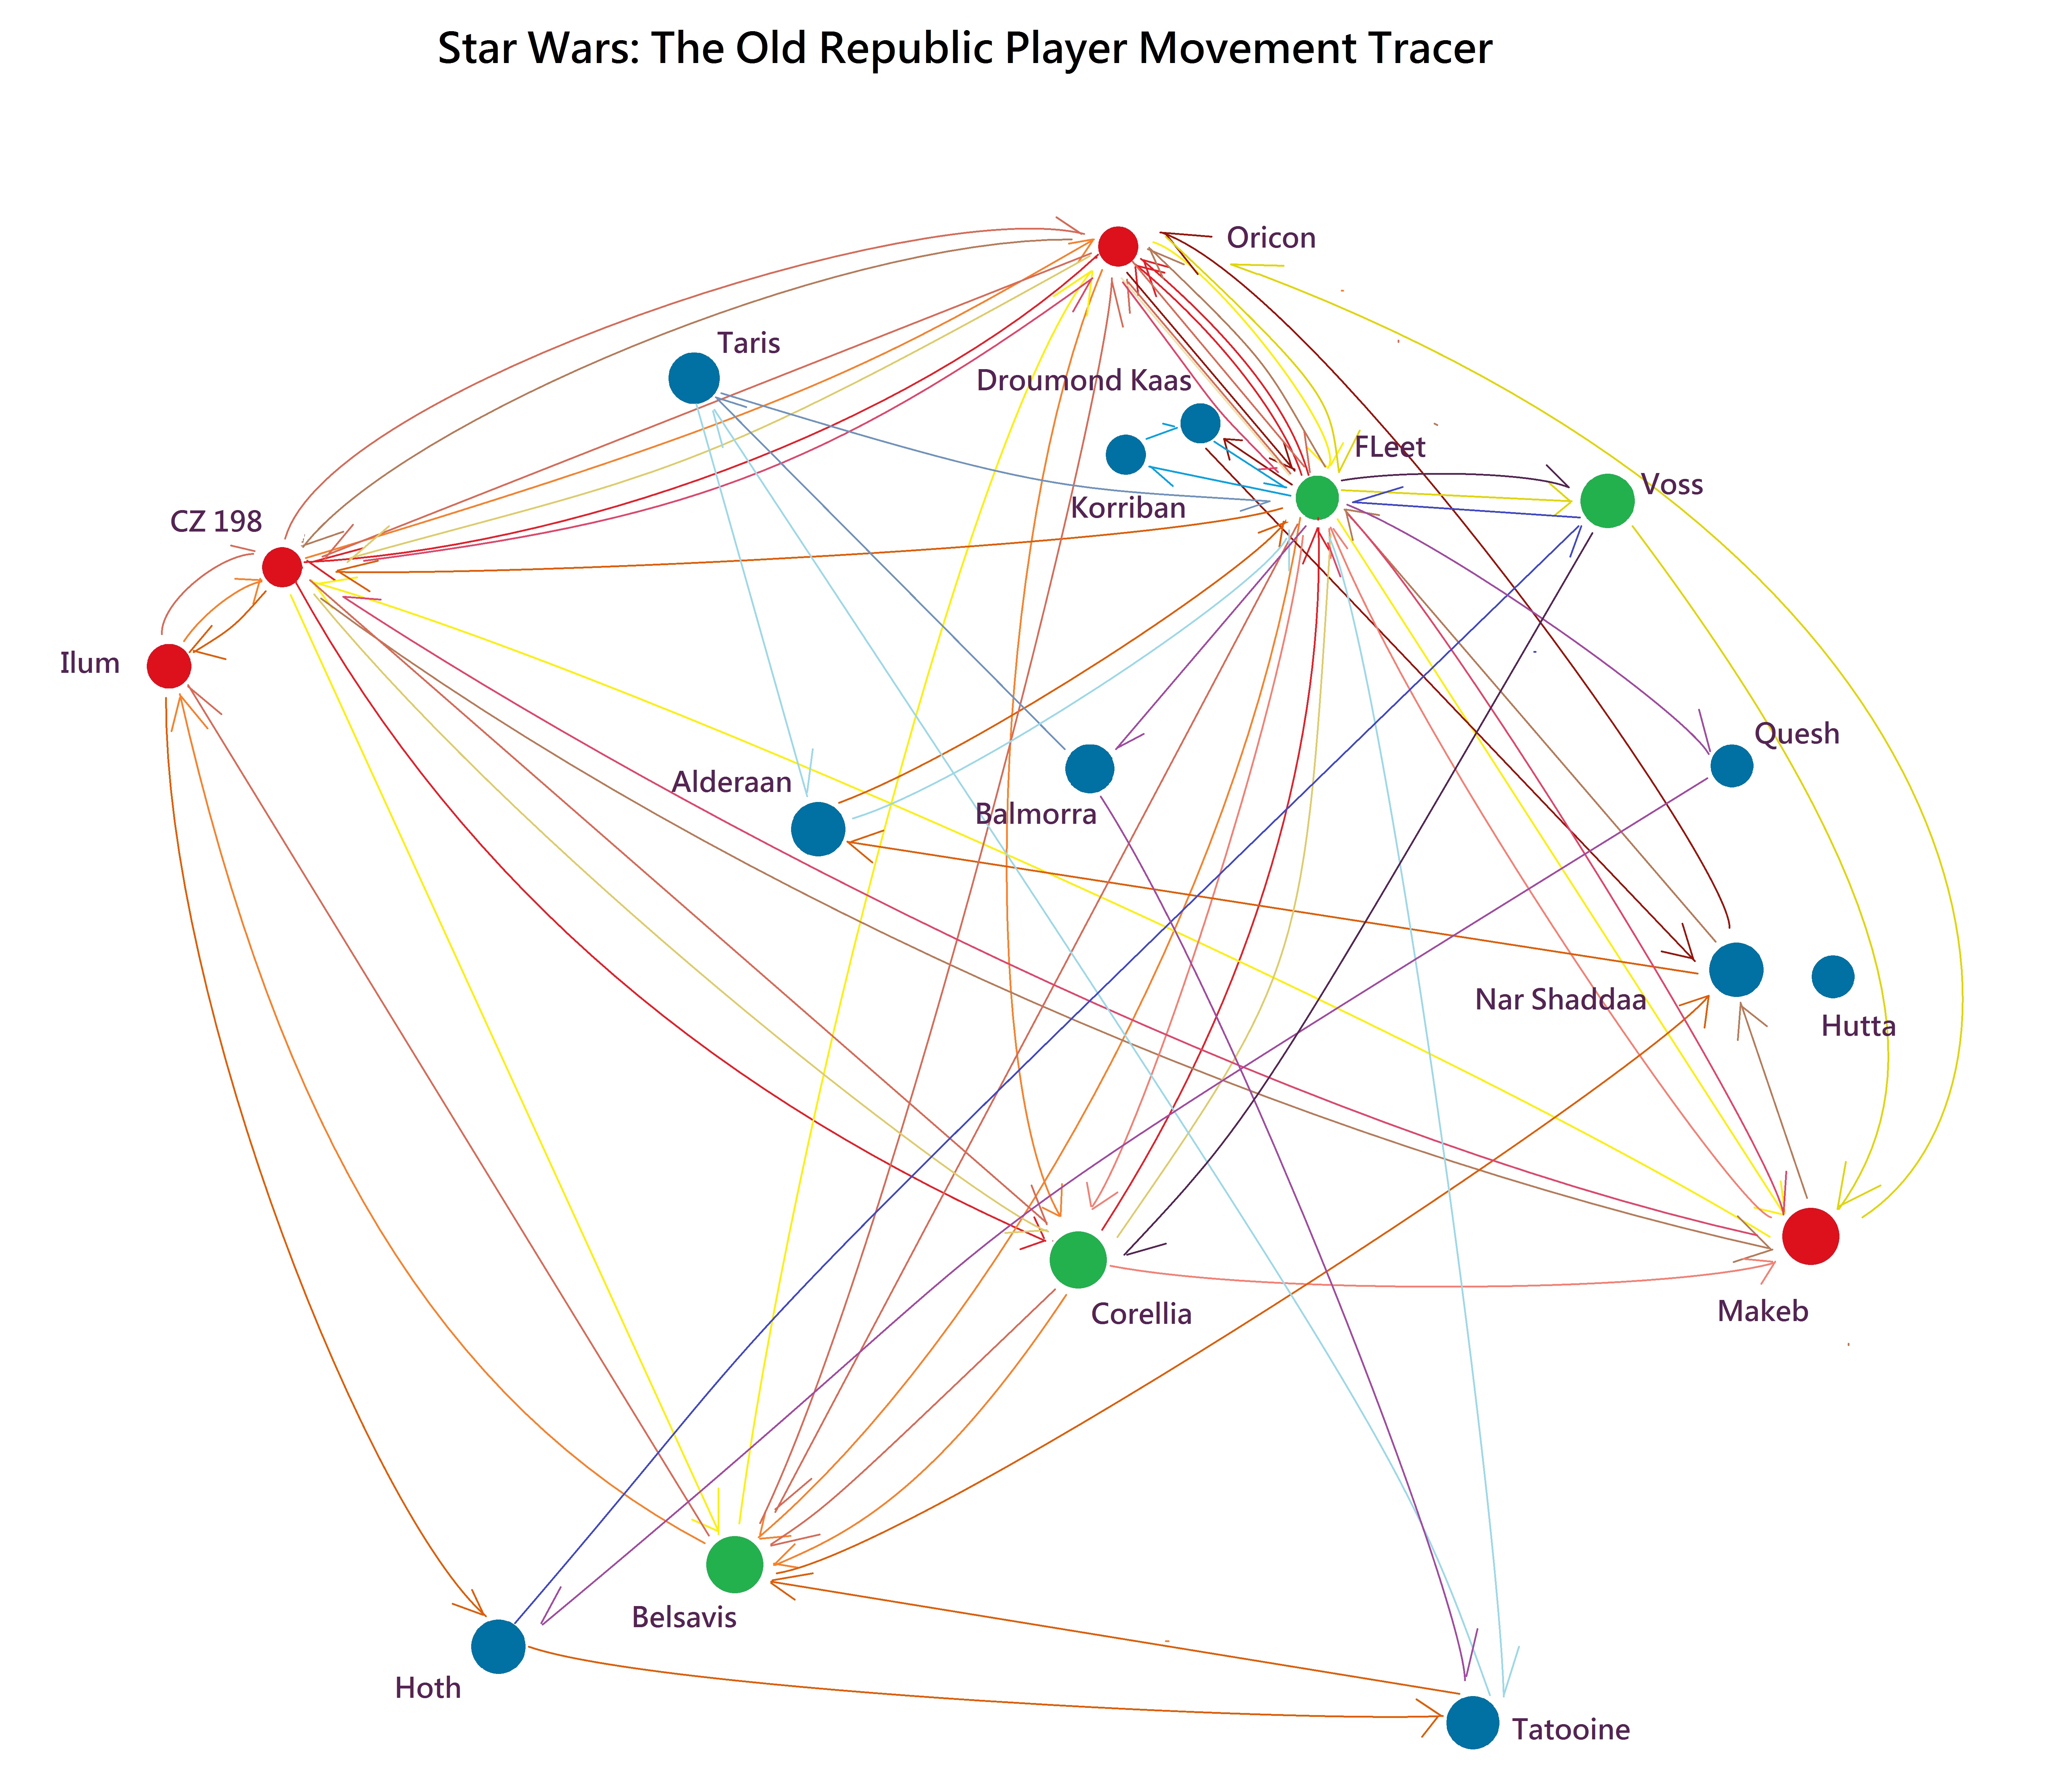
planets' location and use a color to represent each one of them. The result is shown below.
Notice that the warm color paths represent those players who already reach maximum level(55) while the cool color path represent
players who are still leveling. Also planets are being catagorized as well. Red planet suggests that there are only end game content which are
meant for maximum level players. Blue planets are meant for players who are leveling. Lastly green planets have missions for both end game players
and leveling players. From the graph, we can see some system formed. For example: end game players tend to go for certain planets(nodes) everyday even
the order and the paths(link) might be different from each other. Another notable difference is that end game players tend to travel to more planets
in a day while the leveling players only go travel once or twice in a day.
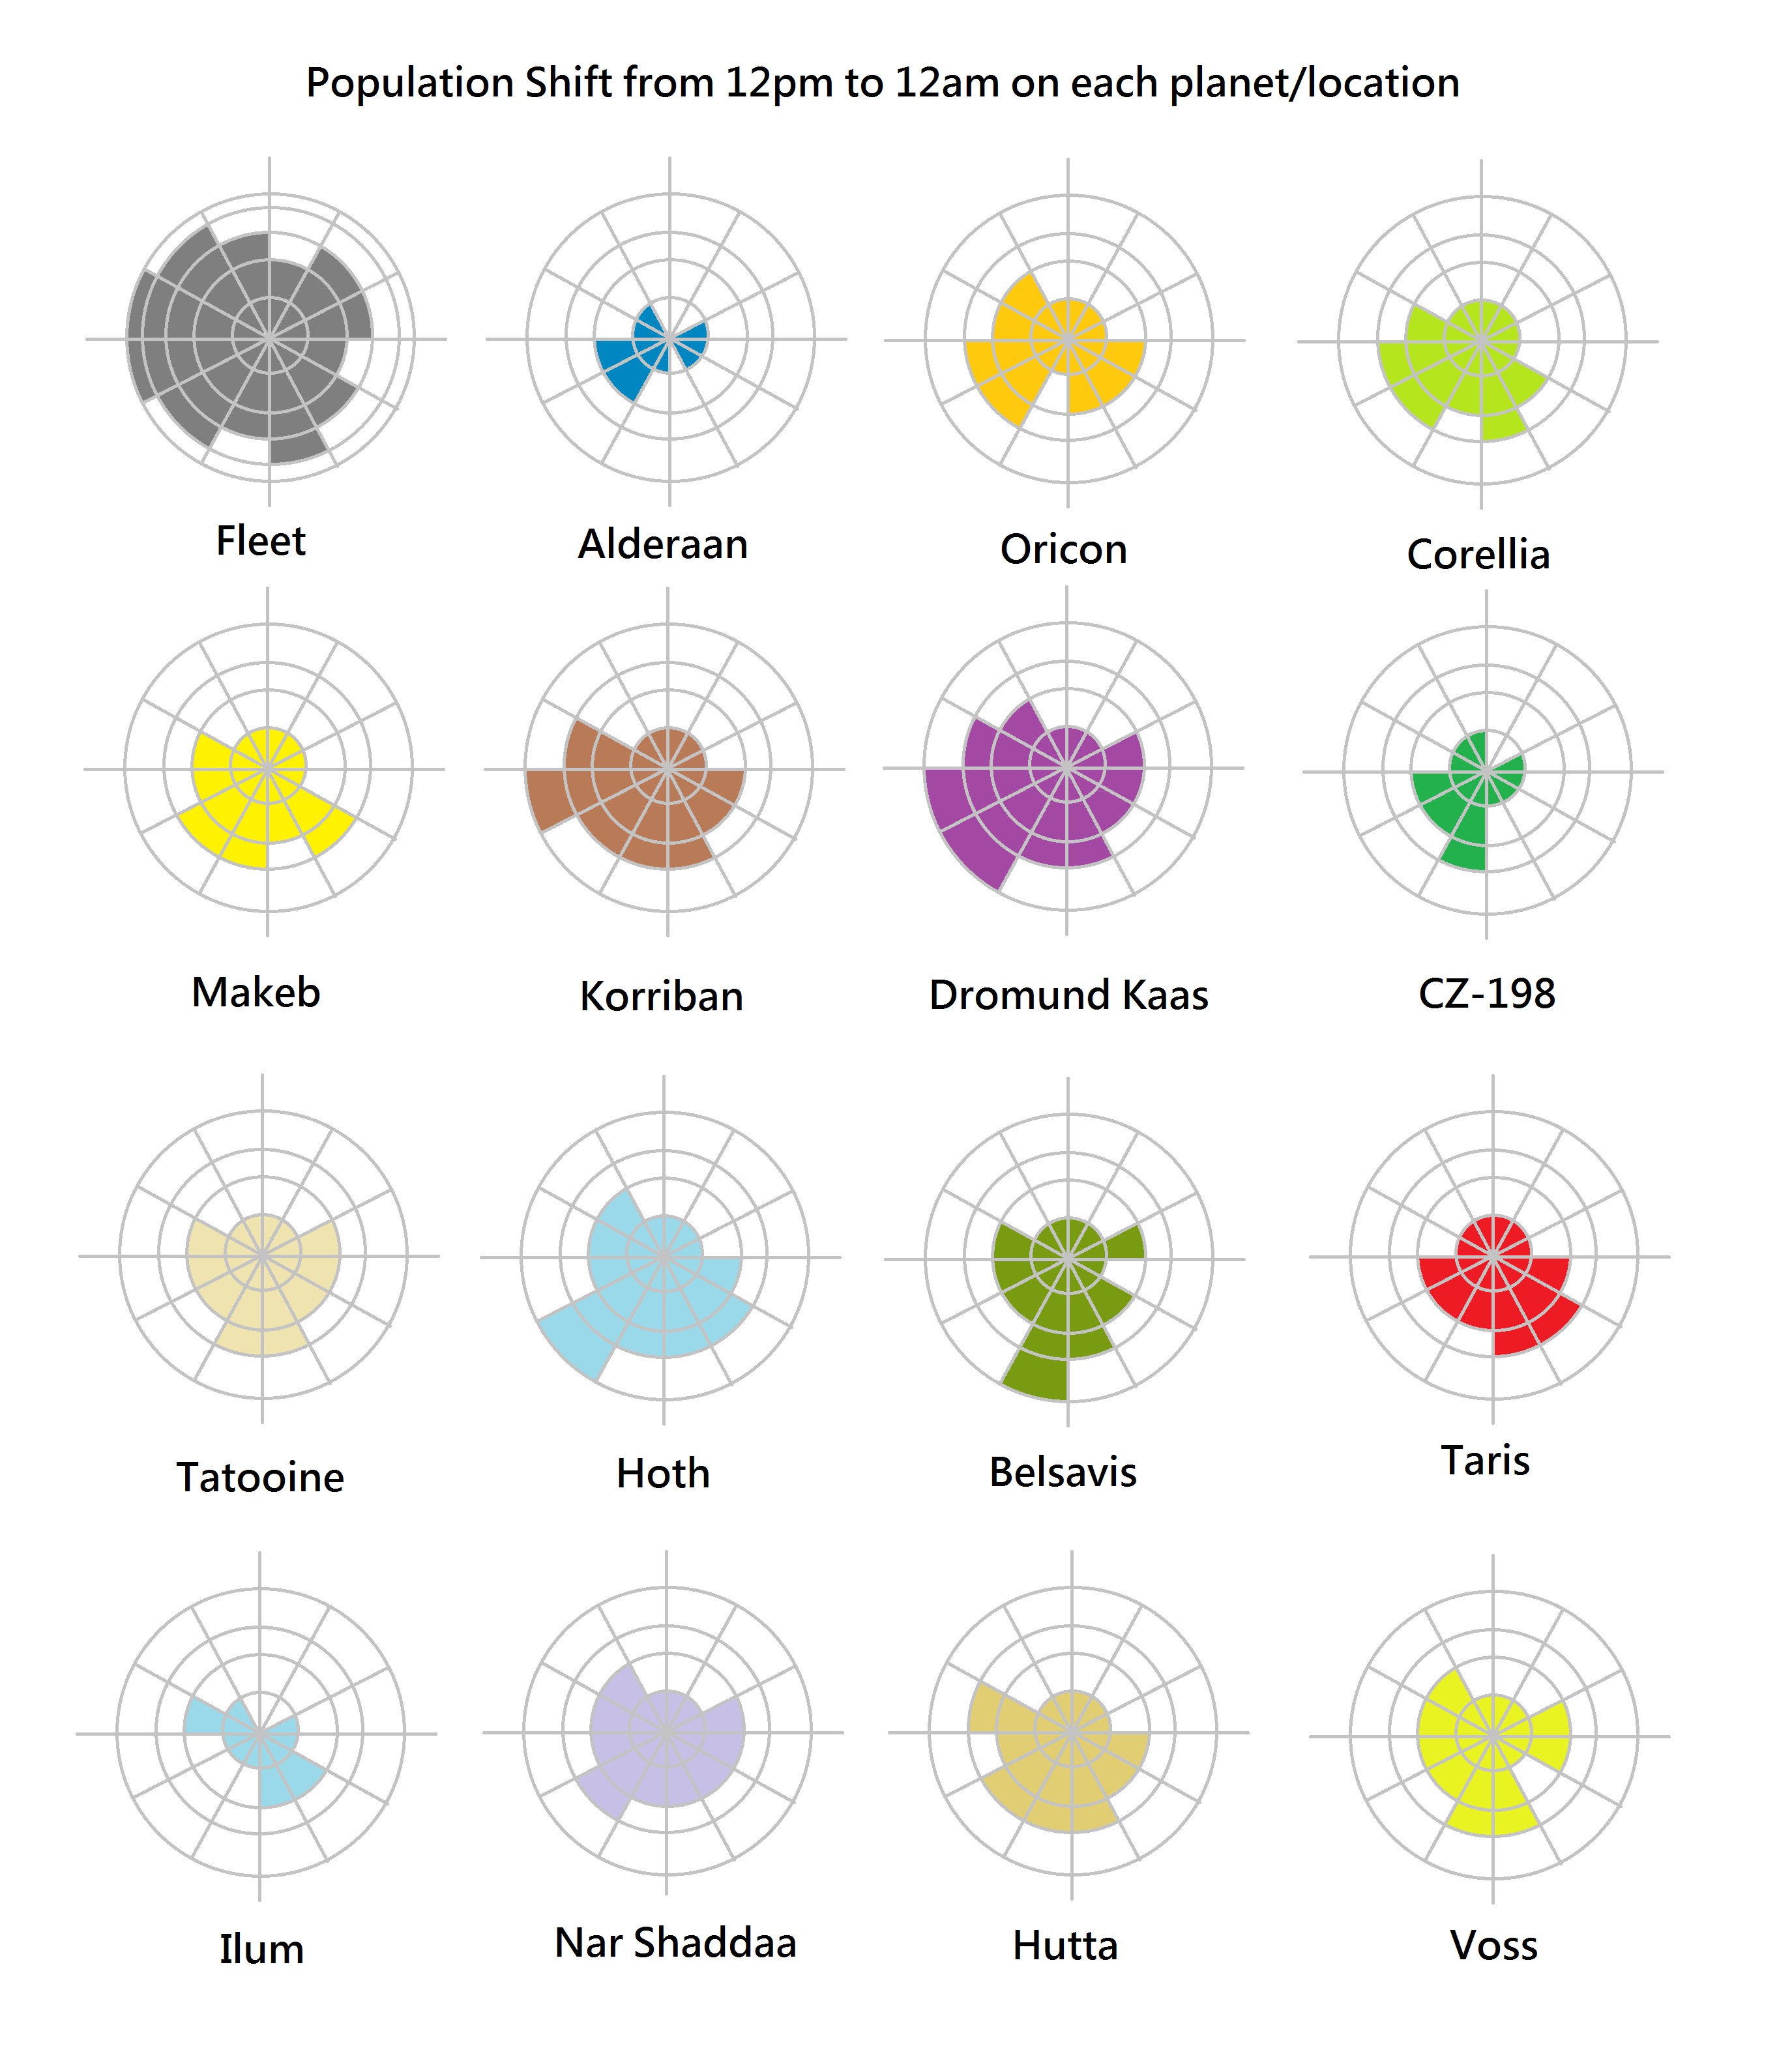
The second image below shows the population/players shift at different time. Originally, I want to see if I can map out the traffic flow between planets.
However based on the first image, I realize that there are multiple ways to travel to different instance. Since this is a mass multi player game, there is no
realistic way to track everyone's path. However I still want to see the relation between the amount of players on each planet and time. So I documented the amount of players every one hour
and made the following graph.
map 1
map 2