Software.Project.
          For my Software project I chose to data vsualization. Using yearly lists of top world events from this site. I used data from the year 1993 to the end of 2013. I chose this time span because my birthday just passed and I wanted to see what kinds of things have happened during the 21 years that I have been alive. I categorized each important date into a type of event. The different categories are represented by different colors:

  • Red: Negative or Violent
  • Blue: Positive
  • Yellow: Neutral
  • Purple: Political or Electoral
  • Orange: Natural Disaster or Disease
  • Green: Memorable

    I constructed my data into a visual that evokes tree rings. I chose this design because to me this project is about showing growth. The growth of the world during my own years of growth. This format makes visible the different patterns of violence, peace, and political changes that have shaped our world and shows that good or bad each event leaves a mark and forms part of the whole. Just like in my life, good or bad, each event or life choice has created who I am now.

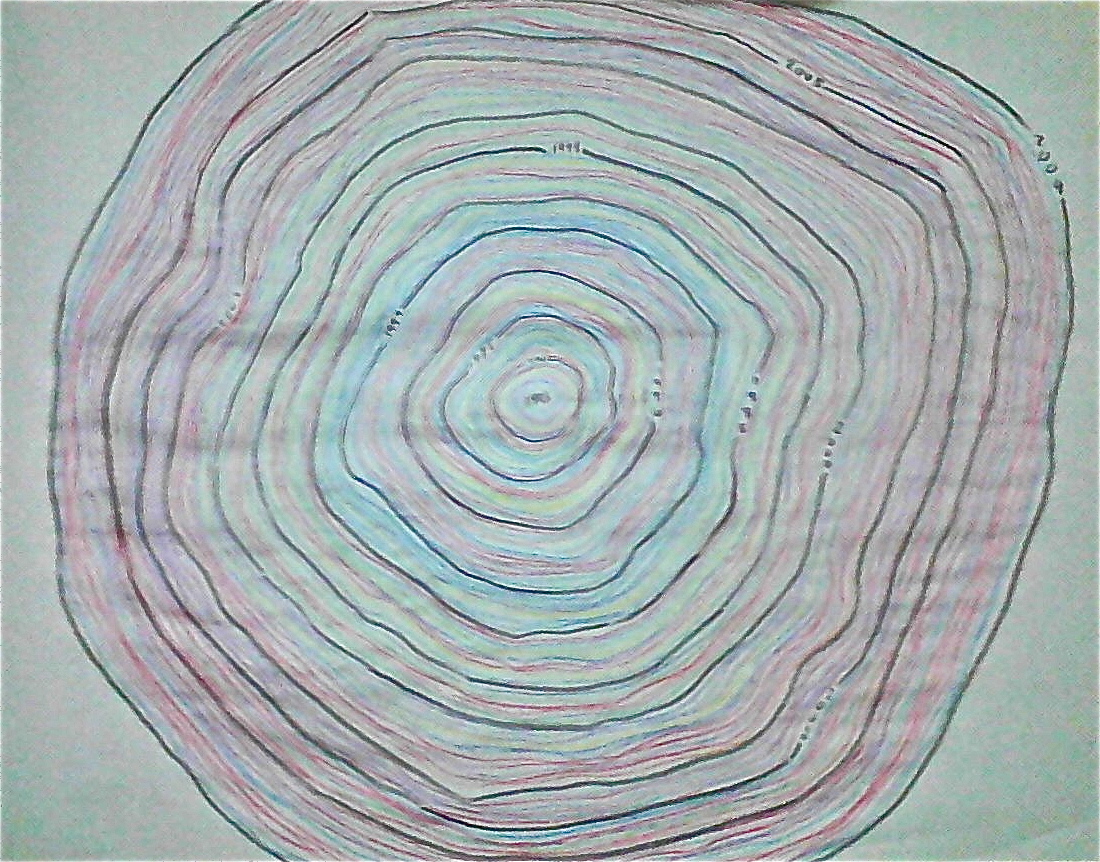
    The poject became so large that it had to be spread accross 3 large pieces of paper.

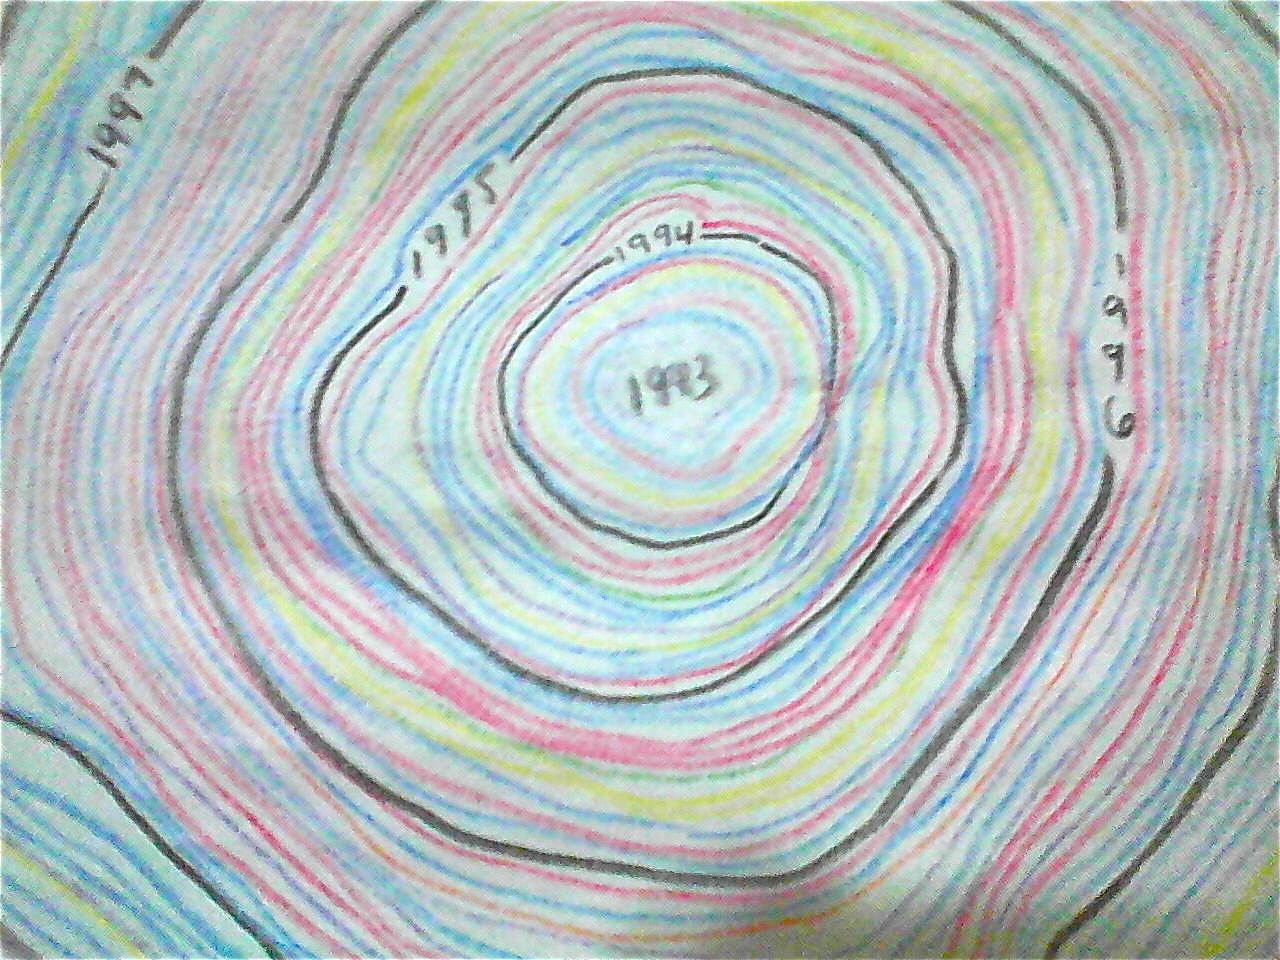
    1993-2004:                             Close up:
        

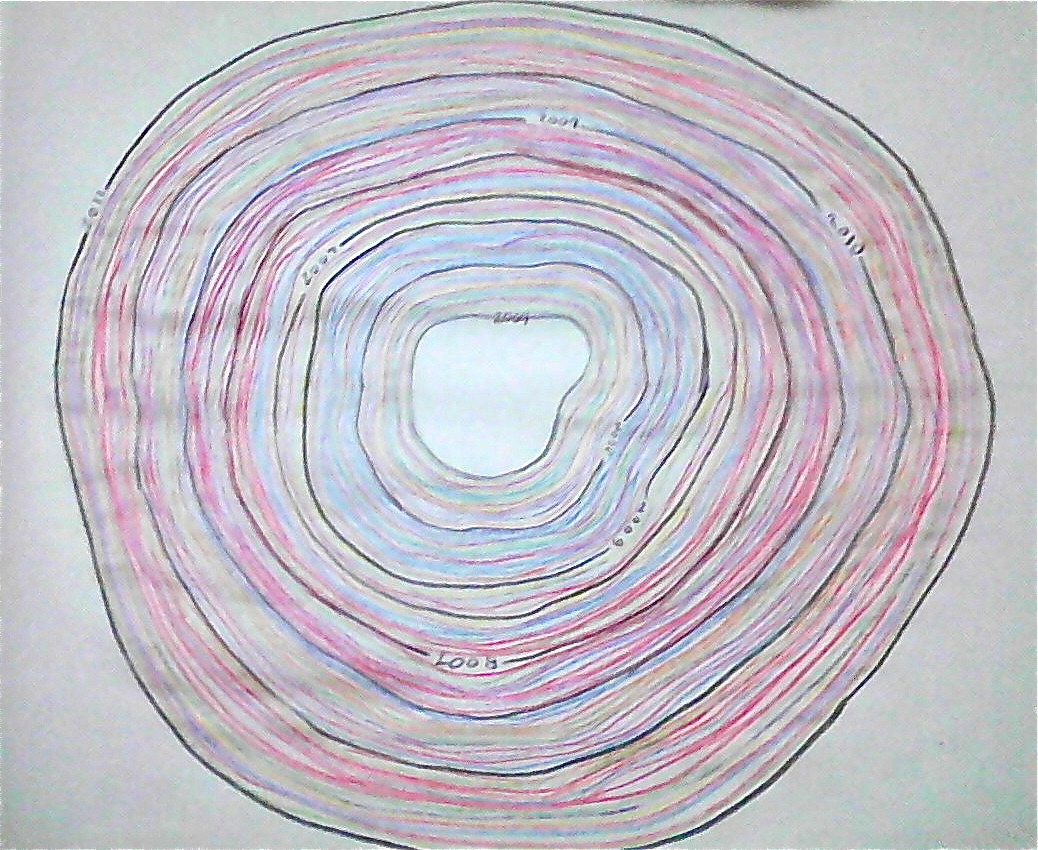
    2004-2010:                             Close up:
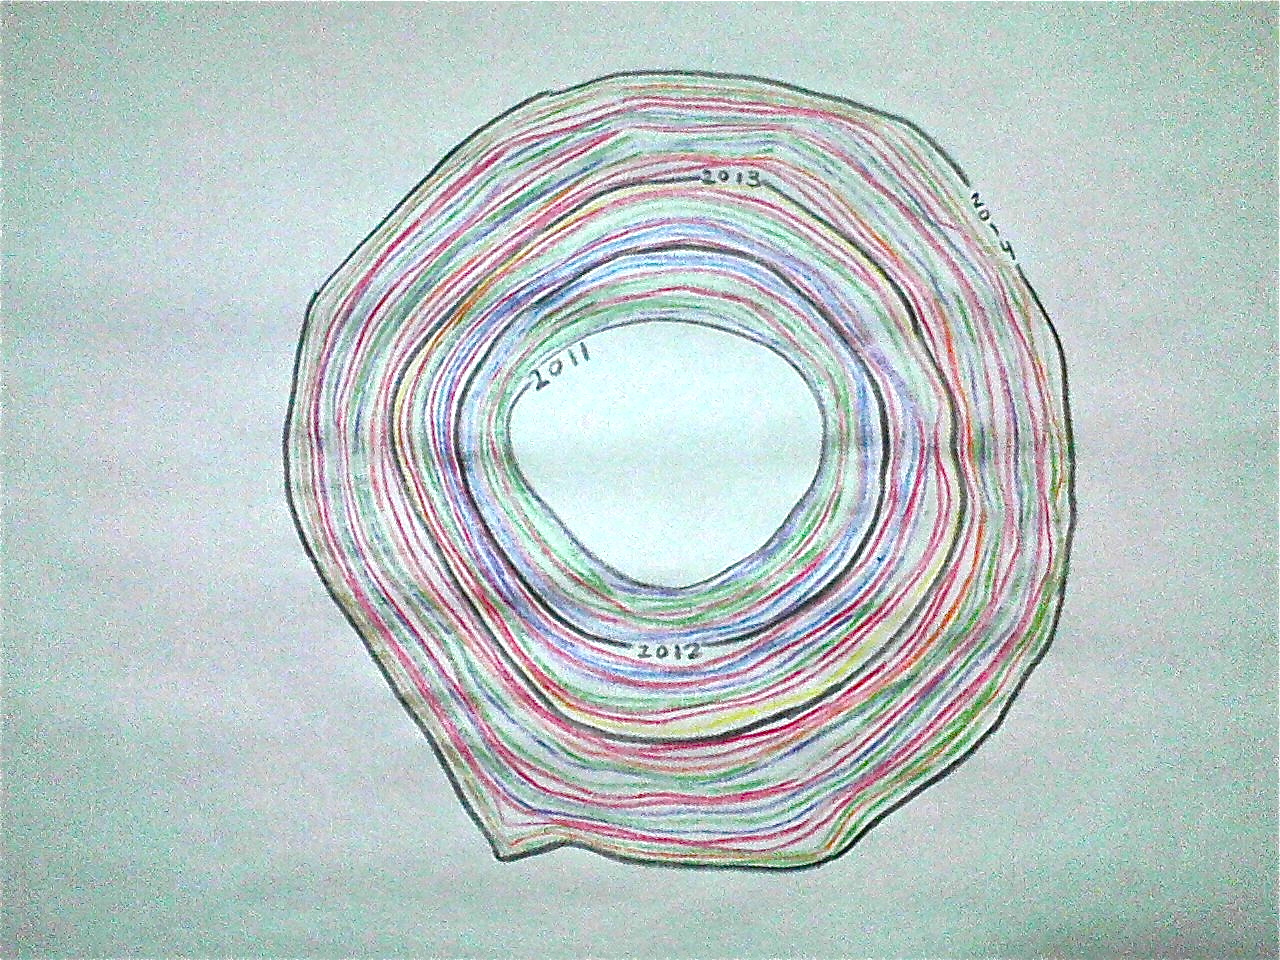
        

                                  2010-2013:
                       
  • Go Home.